> ## Documentation Index
> Fetch the complete documentation index at: https://docs.kodus.io/llms.txt
> Use this file to discover all available pages before exploring further.
# Overview
> Comprehensive analytics and metrics for engineering team performance
## What is Cockpit Analytics
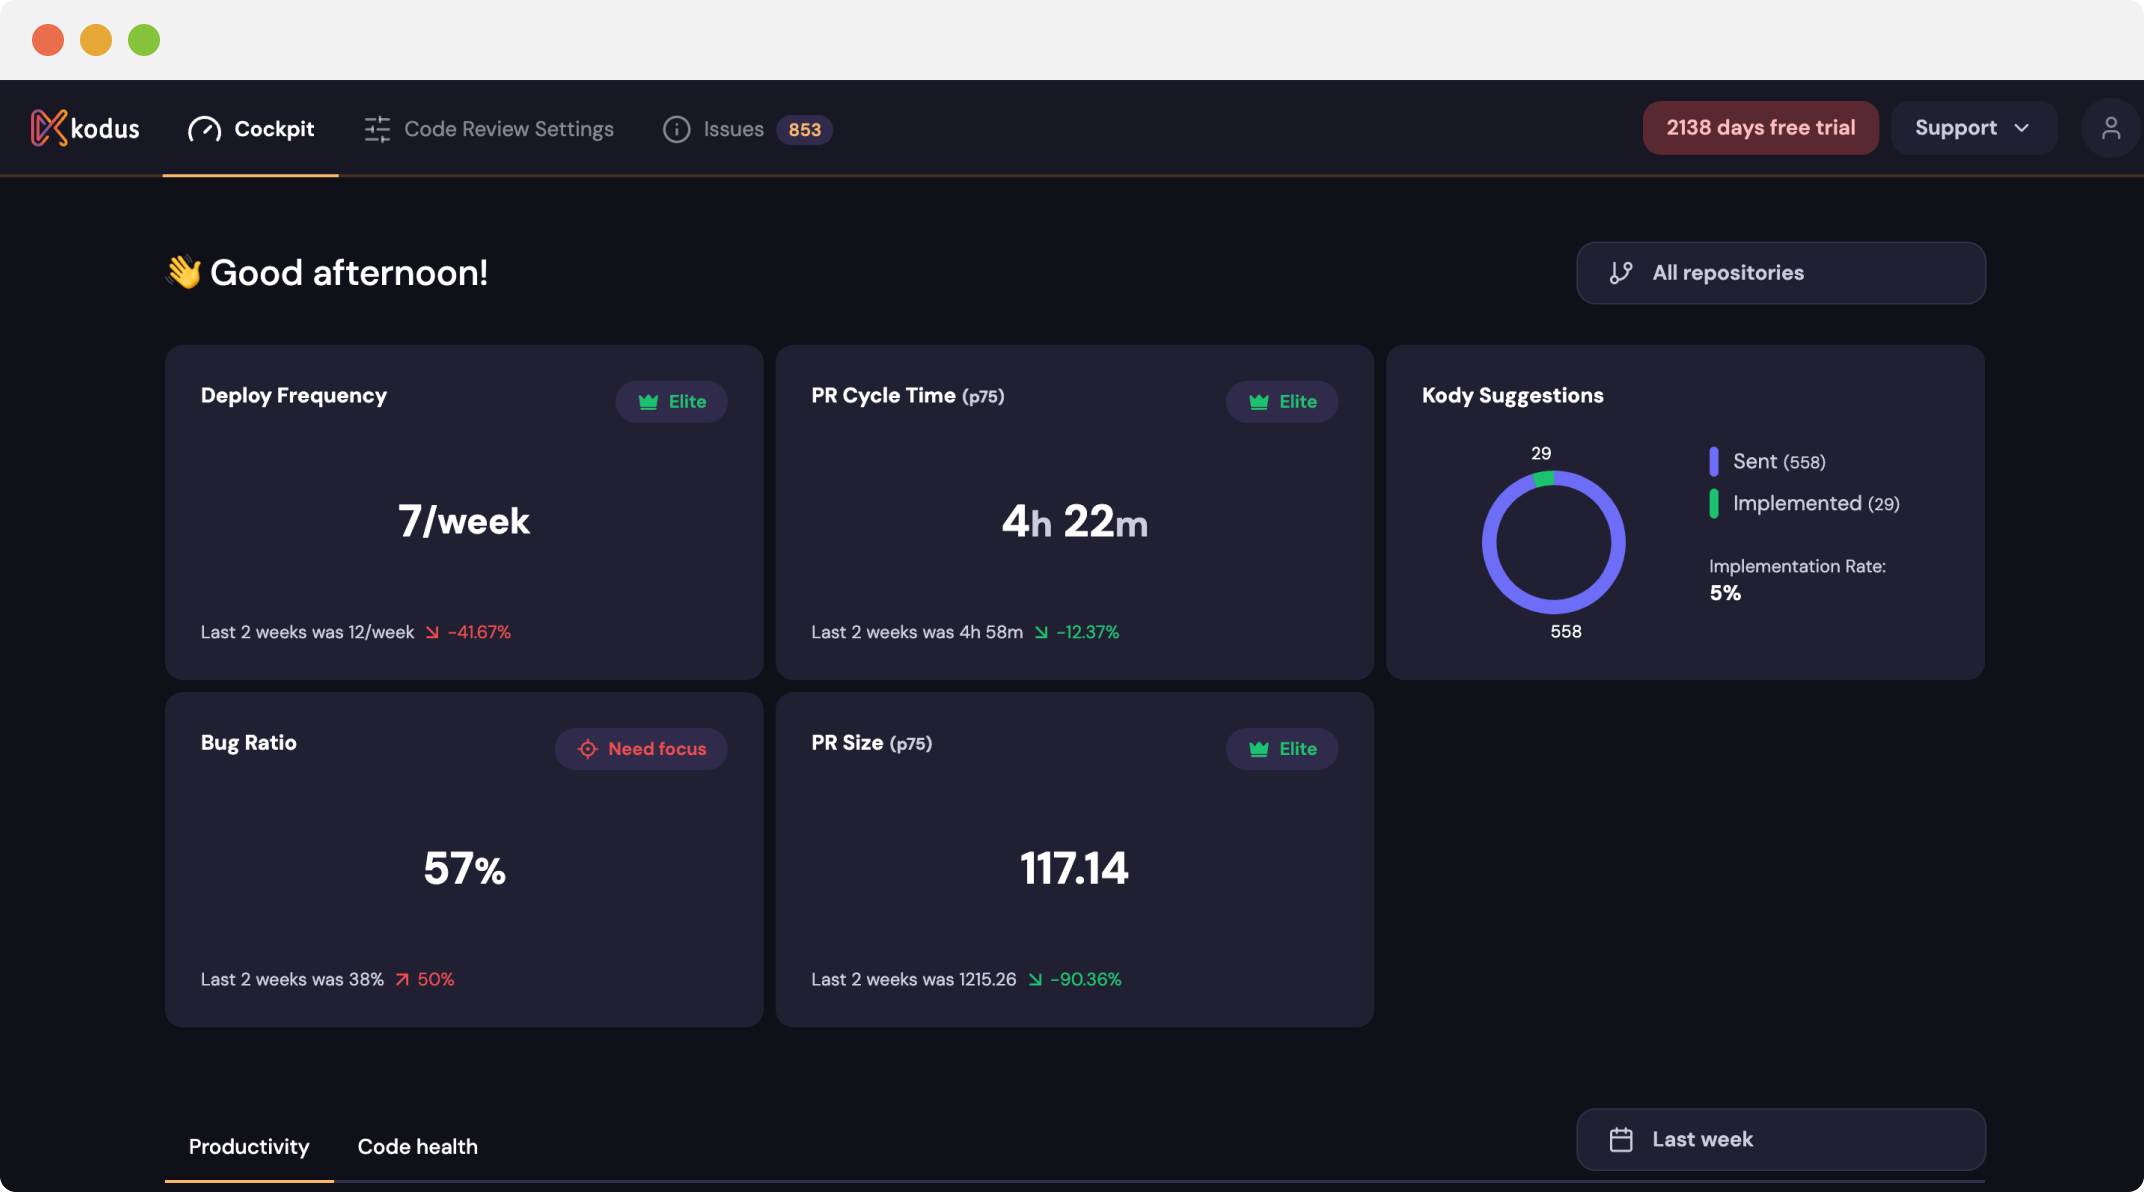
Cockpit Analytics provides comprehensive insights into your engineering team's performance through key metrics that measure productivity, code quality, and delivery efficiency. These metrics help you identify areas for improvement and track progress over time.
Cockpit requires a paid tier: **Teams or Enterprise on cloud**, or **licensed self-hosted Enterprise**. Unlicensed self-hosted (Community) and free BYOK plans don't include it. Self-hosted Enterprise also needs the [Analytics Worker](/en/how_to_deploy/deploy_kodus/analytics_worker) running.
 ## Key Features
* Data refreshes every 30 minutes by default (`ANALYTICS_INGESTION_CRON`)
* Teams/Enterprise on cloud, or licensed self-hosted Enterprise
* AI-powered metric calculation
* 8+ DORA and custom metrics
## The two tabs
The cockpit is split into two tabs:
* **Kodus Review** — how effective Kodus's reviews are: implementation rate, severity calibration, negative feedback, and the health of your Kody Rules. This is about Kodus itself, and it's where you take action. See [Kodus Review](/en/how_to_use/cockpit/kodus_review).
* **Productivity** — general delivery metrics: deploy frequency, lead time, PR cycle time, PR size, and developer activity.
Owners can hide whole tabs or individual metrics for the entire organization — see
[Cockpit Configuration](/en/how_to_use/cockpit/configuration).
## Key Metrics Categories
**Available Metrics:**
* **Kodus Review:** Implementation rate (overall, by severity, by category), negative feedback, repository and Kody Rule health
* **Productivity:** Deployment frequency, lead time, PR cycle times
* **Quality:** PR size, code review effectiveness
* **Team Performance:** Collaboration patterns, bottleneck identification
## How Developer Matching Works
Cockpit tracks developers using the **Git commit username**. This may differ from:
* GitHub/GitLab display name
* Email address
* Kodus workspace account
If you see discrepancies in developer metrics, check that commit usernames are consistent across your team's Git configuration.
## Key Features
* Data refreshes every 30 minutes by default (`ANALYTICS_INGESTION_CRON`)
* Teams/Enterprise on cloud, or licensed self-hosted Enterprise
* AI-powered metric calculation
* 8+ DORA and custom metrics
## The two tabs
The cockpit is split into two tabs:
* **Kodus Review** — how effective Kodus's reviews are: implementation rate, severity calibration, negative feedback, and the health of your Kody Rules. This is about Kodus itself, and it's where you take action. See [Kodus Review](/en/how_to_use/cockpit/kodus_review).
* **Productivity** — general delivery metrics: deploy frequency, lead time, PR cycle time, PR size, and developer activity.
Owners can hide whole tabs or individual metrics for the entire organization — see
[Cockpit Configuration](/en/how_to_use/cockpit/configuration).
## Key Metrics Categories
**Available Metrics:**
* **Kodus Review:** Implementation rate (overall, by severity, by category), negative feedback, repository and Kody Rule health
* **Productivity:** Deployment frequency, lead time, PR cycle times
* **Quality:** PR size, code review effectiveness
* **Team Performance:** Collaboration patterns, bottleneck identification
## How Developer Matching Works
Cockpit tracks developers using the **Git commit username**. This may differ from:
* GitHub/GitLab display name
* Email address
* Kodus workspace account
If you see discrepancies in developer metrics, check that commit usernames are consistent across your team's Git configuration.